Audience Measurement Report
The Audience Measurement Report allows station operators to gain valuable insights on their Video On Demand and Live Stream views. Reports are generated from viewer telemetry directly from the Reflect CDN. This means it doesn't matter how viewers engage with the station's content, as long as the content is streamed through the Reflect CDN the views are counted. This includes viewers watching on the Cablecast Web Player, Cablecast Streaming Apps, Branded Streaming Apps and even custom player integrations.
Note Audience Measurement Reports require a Reflect or Reflect+ CDN subscription. If you do not yet have Reflect or Reflect+, please reach out to the Cablecast Sales team at sales@cablecast.tv for more info.
What data is collected
Audience Measurement Reports collect Viewer Count and Time Viewed for Live Streams and Video On Demand content. These metrics are periodically rolled up by the Reflect CDN and then pulled into the Cablecast system to be made available for reporting. For Video On Demand content rollups are for a twenty-four hour period, while live streams have a rollup period of thirty minutes.
How is the data presented
Audience Measurement Reports have three main sections, plus a tool bar that helps setup and filter the report.
The Toolbar
The toolbar at the top of the screen has several drop downs that control how the Graph is presented, and the time range of the report.

The Graph
The graph is a visual representation of the top 10 selected streams in the report's time range. The graph is available in two displays.
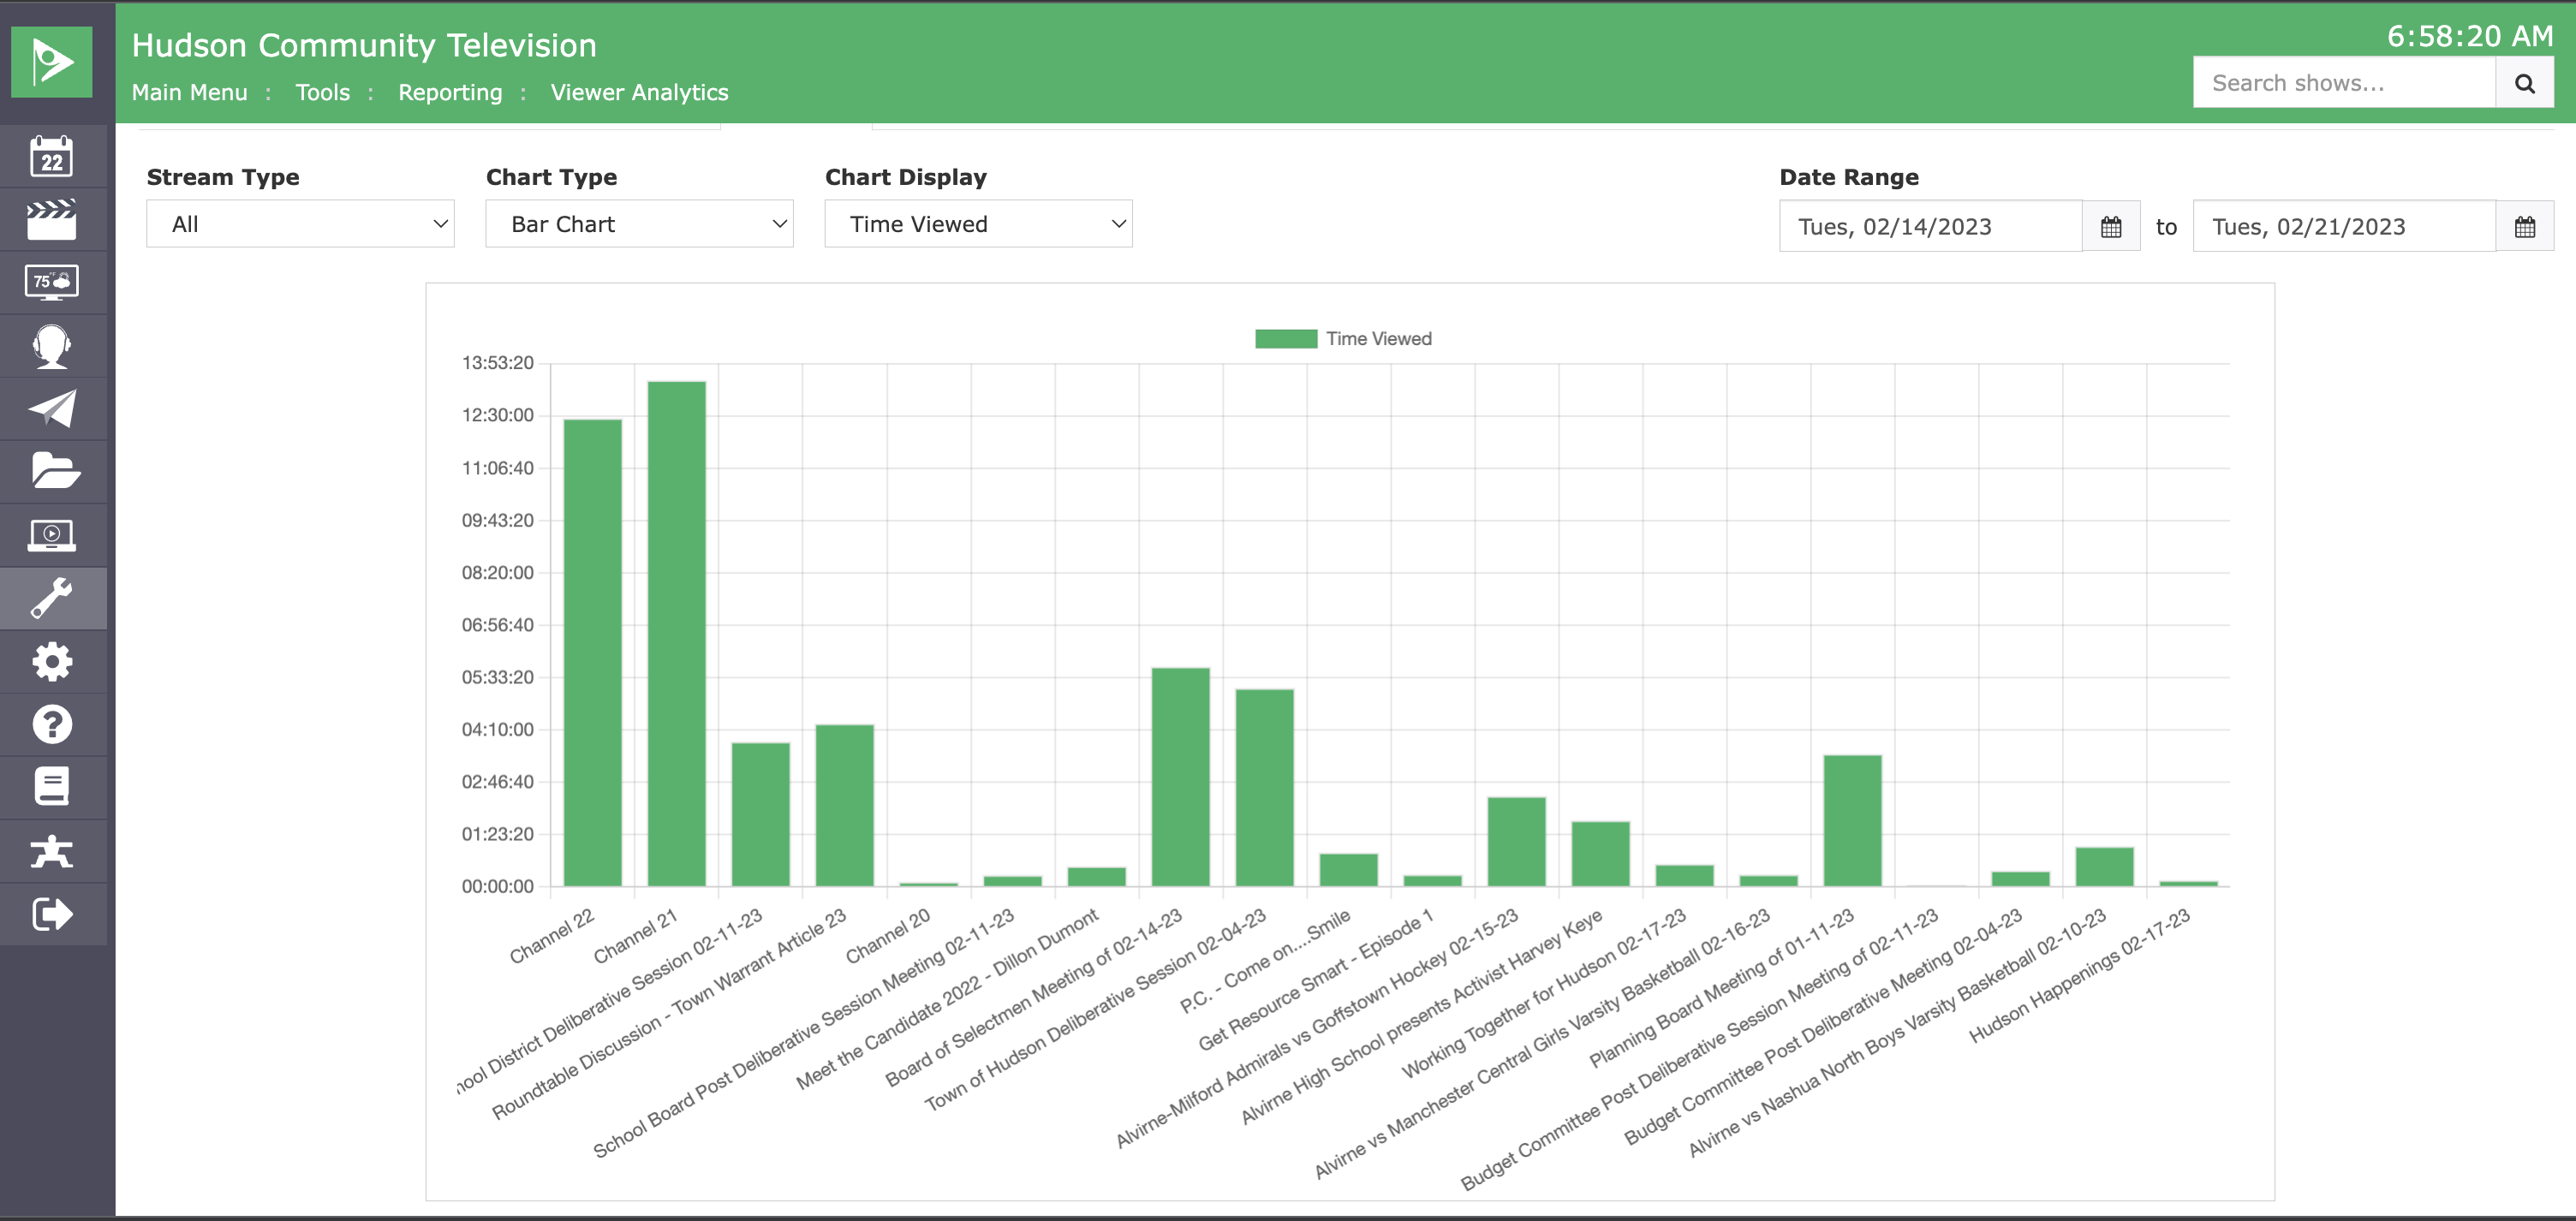
- Bar Chart: Displays top items along the x-axis and uses the chosen metric from Chart Display as the y-axis in an easy to read bar chart.
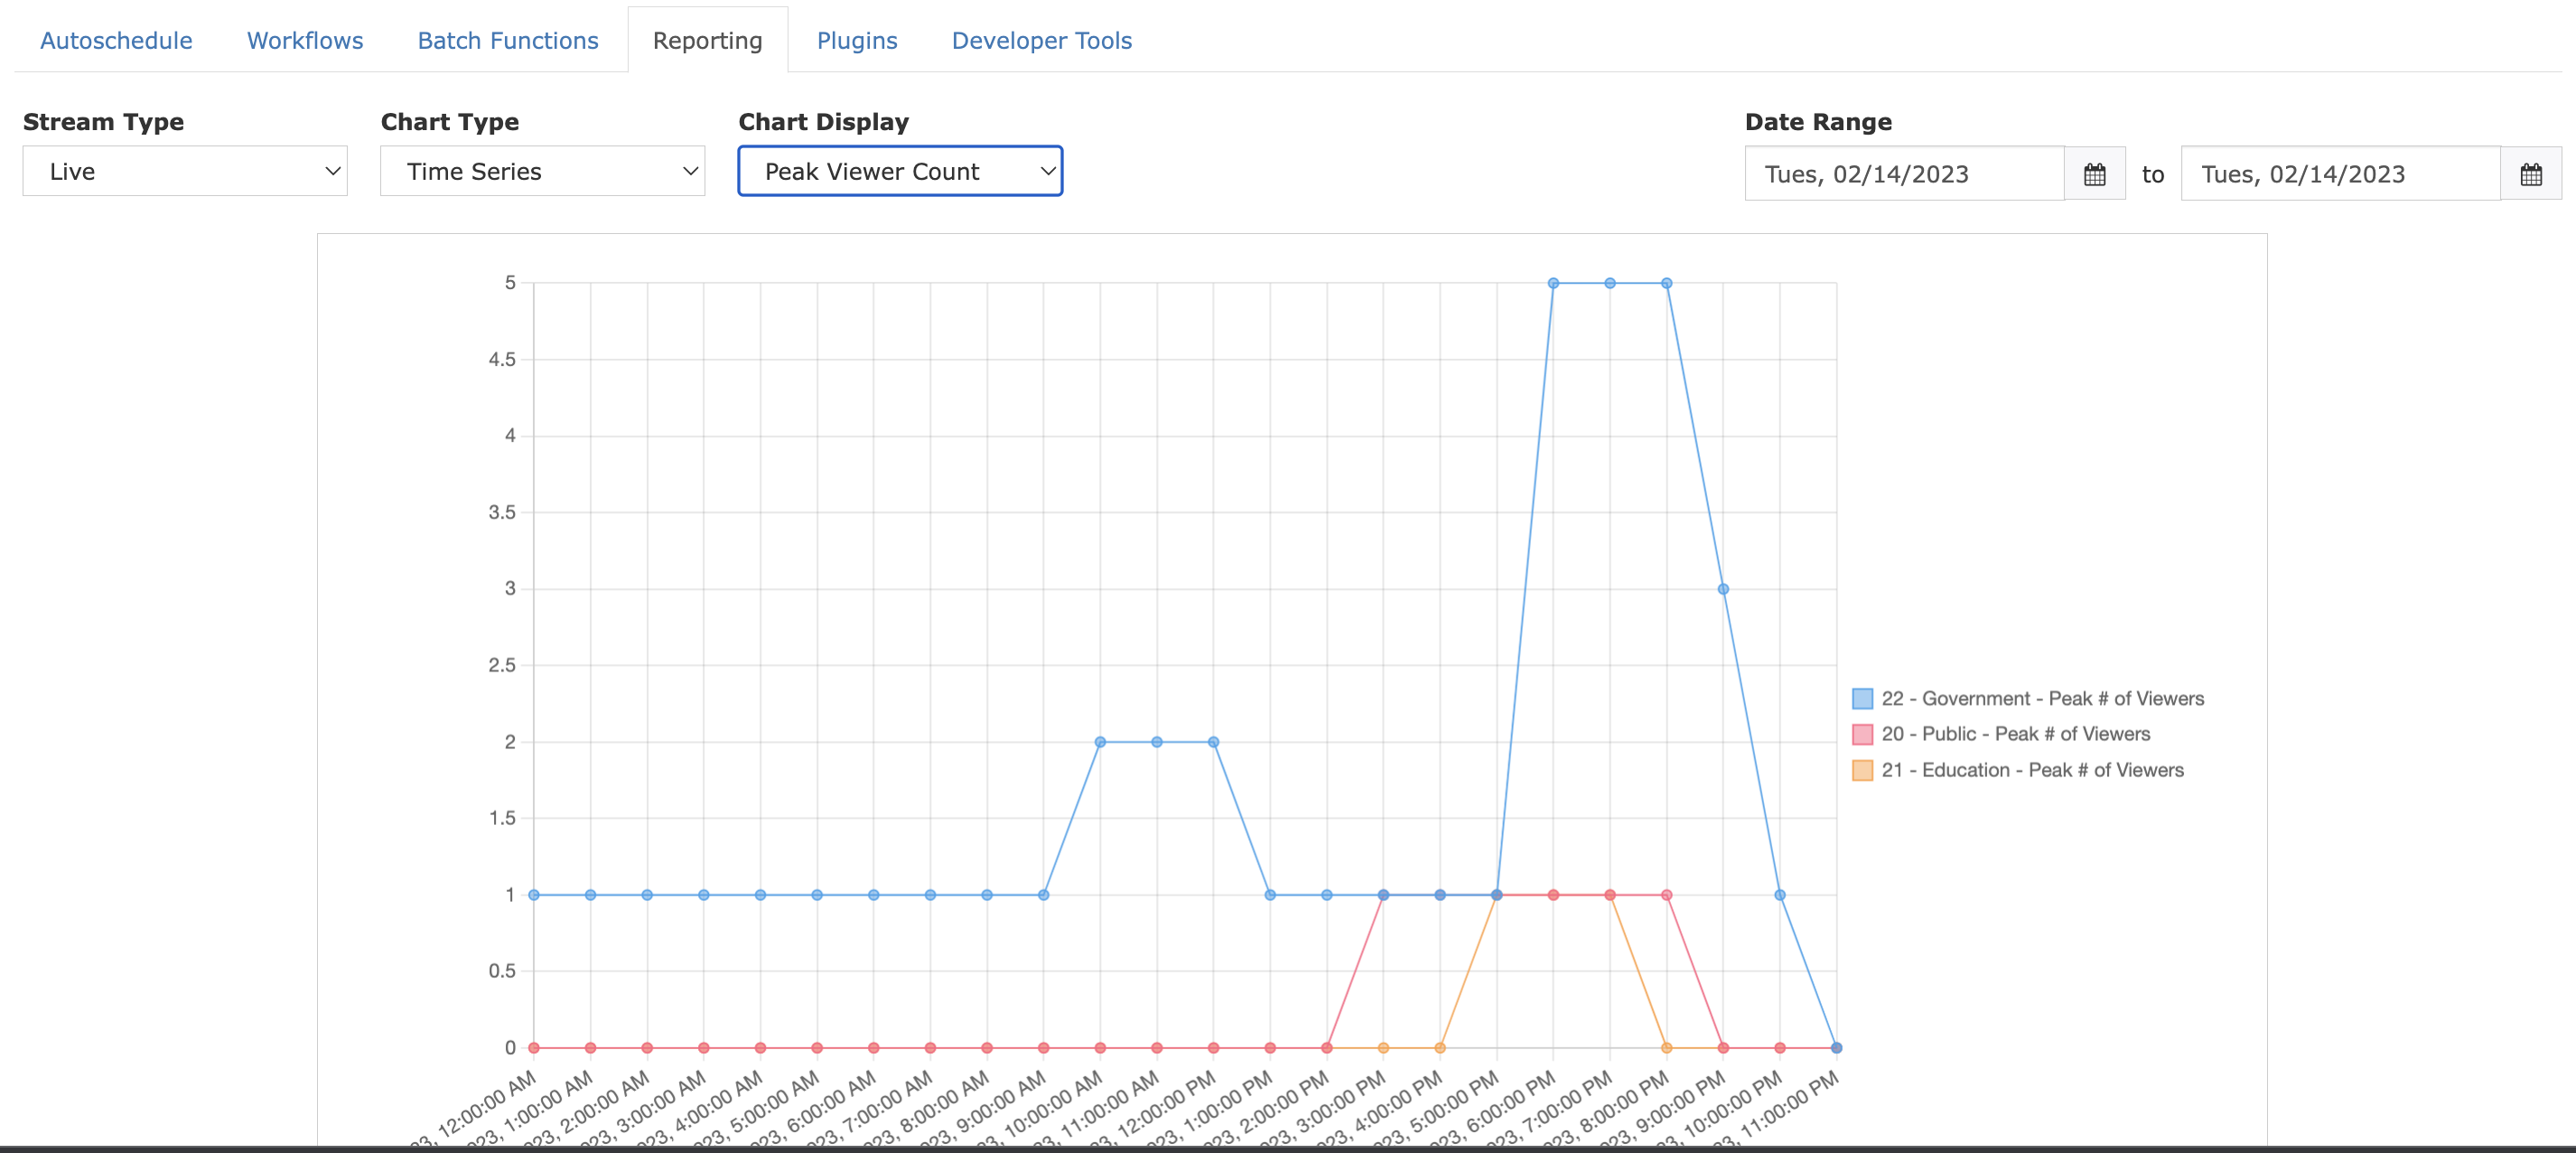
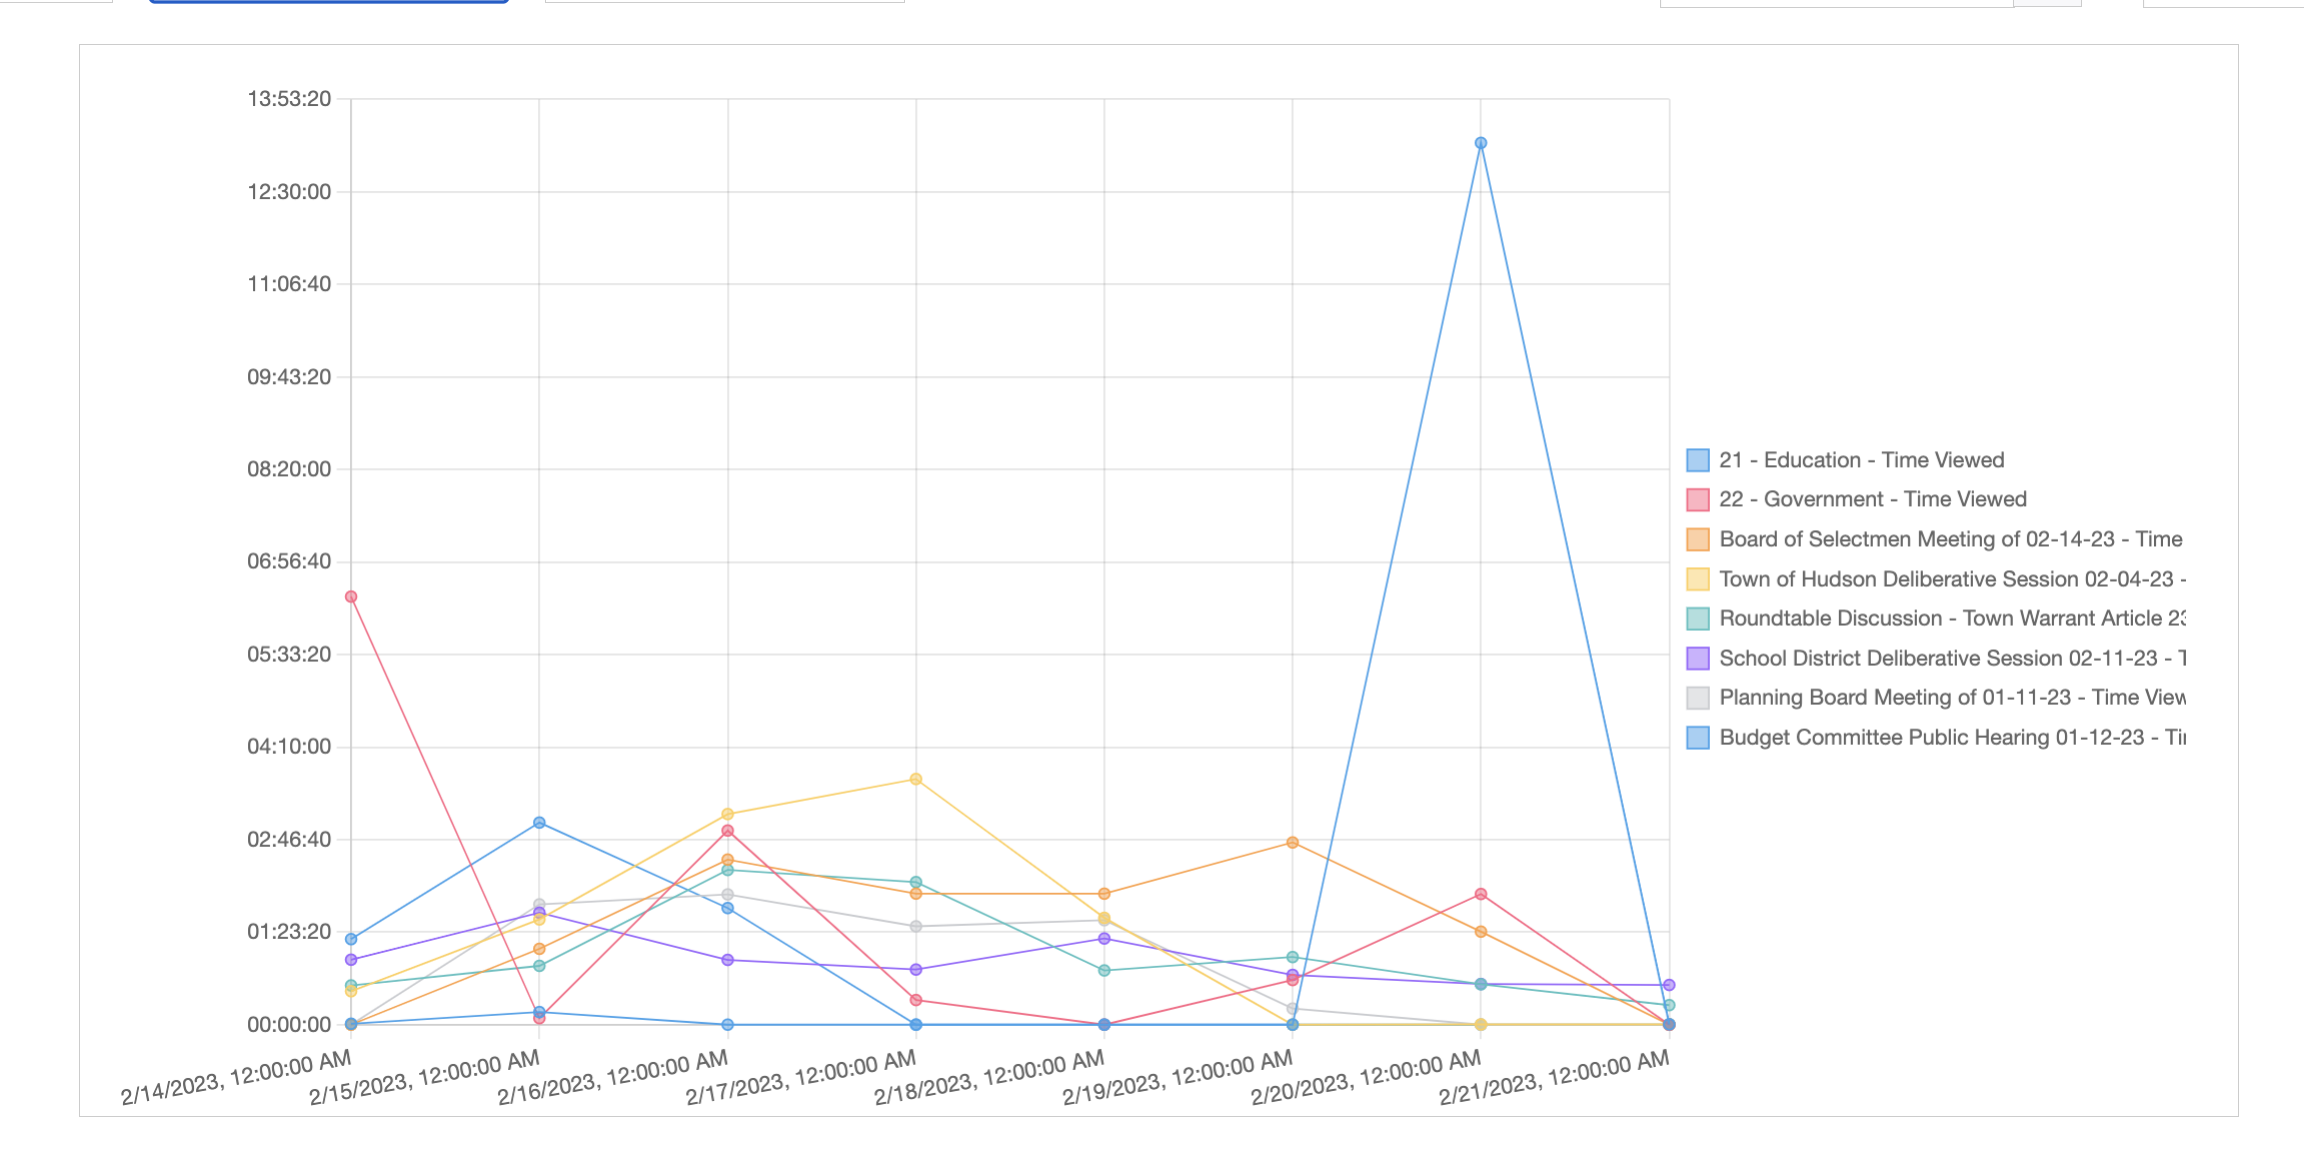
- Time Series: Displays top items with the x-axis being the selected time range of the report and the y-axis being the metric chosen from Chart Display. Allows seeing when a stream was viewed most in time.
Stats Summary
The stats summary provides quick, at a glance, easy to read summary of total streaming for the selected time range.

Data Table
The data table gives access to raw numbers of the streaming metrics for the report's time range. Individual streams can be expanded to see metrics for individual data rollups. The data table can also be downloaded as a CSV for import into spreadsheet programs such as Excel or Google Docs.
Quick Tips
Want to see how many viewers tuned into a live event?
Switch Stream Type to Live Streams and the Chart Type to Time Series and set the Date Range of the report to the day of the live event. When viewing a single day the Time Series chart will switch to an hour by hour breakdown to really help narrow in on live stream views.